Recognizing Common OCT Artifacts for Successful Clinical Management of Glaucoma; Figures
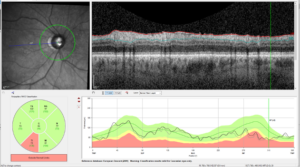
Figure 1. Internal metrics according to platform identifying scan quality. ART is 100 for radial and non-APS circle scan, 25 for APS circle scan, 9 for APS PPole H/V and non-APS ONH volume. When not using preset, the possible range is 1-100. In this scan the image quality is poor, yet the quality score is acceptable at 28. Notably, however, the ART is 2 indicating that it has only been averaged twice, and this scan usually has an ART of 100. This is the cause of the poorer image quality.

CASE 1. PVD EFFECT ON RNFL
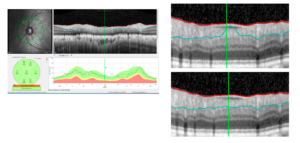
Figure 2. High resolution raw data scans show the vitreous’ effect on the RNFL, with tenting of the RNFL inferotemporally due to vitreous traction causing RNFL thickening (top), and then subsequent vitreous release with resulting RNFL edema (bottom).

CASE 2. RETINAL CURVATURE FLATTENING ARTIFACT
Figure 3. Computer analysis must flatten out the RPE. The raw scan on the left shows a continuous RPE. When the scan is flattened for RPE analysis (right) it shows artifactual RPE elevation with overlying RNFL thickening.

Figure 4. Fixing a segmentation artifact: Here the posterior border of the RNFL is incorrectly defined due to an epiretinal membrane.

Figure 5. Fixing a segmentation artifact: The circle tool is used here to fix the artifact.

Figure 6. Fixing a segmentation artifact. With the artifact fixed, the RNFL thickness is in the normal zone.

CASE 3. FIXING FOVEAL POSITION ERROR
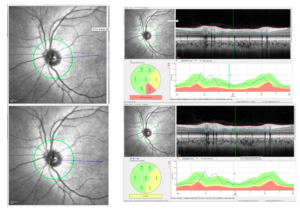
Figure 7. Fix to reposition fovea. In the original RNFL scans, correcting foveal position can change the percentile values of the RNFL in each quadrant.

CASE 4. PERIPAPILLARY ATROPHY IN A HIGH MYOPE
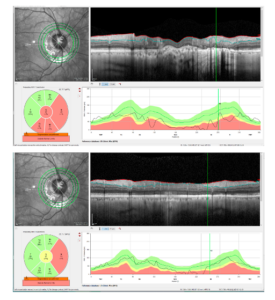
Figure 8. A 64-year-old African American woman with -7.50 myopia and pressure applanation of 12 mm Hg. In this patient there is clear peripapillary atrophy that results in difficulty in assessing the RNFL using the inner circle. The outer RNFL scan is more accurate as it is less affected by peripapillary atrophy.

